Connect stores, e-commerce, inventory and advertising to inform margin and stock decisions. Start with SKU-level data and build toward forecasting and campaign evaluation.
Conceptual data-to-operation flow, adapted to the agreed project scope.
Start with the operating model. Find the right problem.
Channels introduce different product identifiers and revenue cutoffs. Distinguish sales growth from contribution after discounts, returns and fulfilment costs.
For these teamsPlanning, merchandising, e-commerce, marketing and IT
01 / INPUTS
POS and online orders
Stock, movements and returns
Ad spend and product costs
02 / CONTEXT
Unify products and orders
Align scope and time, preserving the path to source records.
An illustrative path from data to decisions. Interfaces, access and evaluation depend on the agreed scope.
PRIORITY WORKFLOWS
Choose the work to improve first.
01 / CAPABILITY
Store and e-commerce analytics
Order, shipment, store sale and accounting dates may differ. Define which event drives each management metric.
Align channels by product, store and period to compare contribution and stock. Show the effects of returns and discounts that sales rankings can conceal.
Start with existing information. Design the connections.
Before adding systems, identify sources, access methods and refresh owners. CSV and existing reports can establish value before committing to integrations.
01POS and online orders
Separate orders, line items and returns. Align when shipping, discounts and cancellations enter revenue.
02Stock, movements and returns
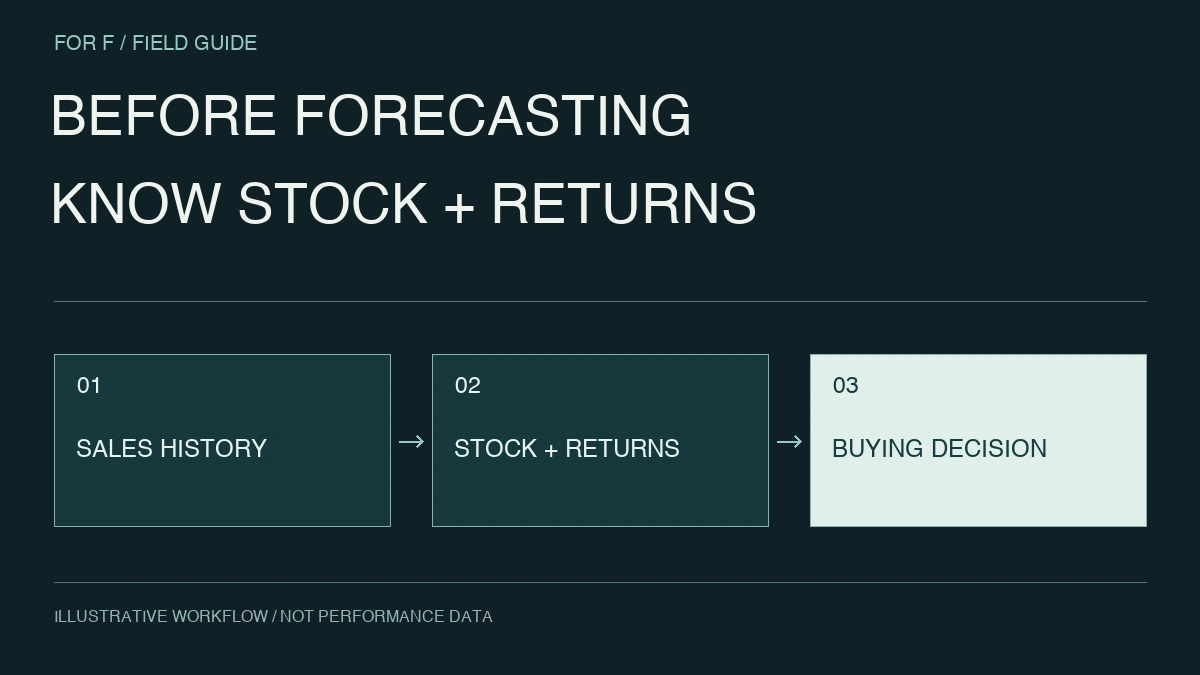
Check sellable inventory by SKU, store and date; distinguish stockouts and closures from zero-demand days.
03Ad spend and product costs
Capture promotion dates, included products and price changes, using only information available at prediction time.
Confirm refresh schedules and API constraints for commerce, POS and stock systems. Retain history for cancellations, returns and product merges.
This is an illustrative engagement, not a client case study or a claim of results.
If store and e-commerce totals disagree, begin with reconciliation rather than forecasting. Select one category and agree with sales and finance whether the view uses order, shipment or return dates.
Prototype product-level sales, discounts, returns and sellable inventory with a path back to line items. Check whether the evidence can separate unavailable stock from weaker demand.
What this prototype delivers
Reconcile against existing reports at the same cutoff and explain differences at line-item level. Agree how later returns affect figures before extending into purchasing or forecasting.
Useful inputs for an initial discussion
Order, return and inventory history with a product master
Revenue cutoffs and rules for shipping, discounts and returns
Promotion plans and the current buying decision process
The set does not need to be complete; discovery can establish missing inputs and access conditions.
DISCOVER → PROVE → BUILD
Can buyers spend less time reconciling information and explain their buying decisions?
Select one category and channel for reporting or weekly forecasting.
01
Time-based evaluation
Use only promotions and prices known at the historical forecast date.
02
Stockout handling
Compare results with explicit treatment of unavailable periods.
03
Buyer review
Compare current and proposed orders under lead-time, pack-size and workload constraints.

 RETAIL & COMMERCE / OVERVIEW