 MANUFACTURING / CAPABILITY
Traceable identifiers
Map product, work order, process and lot. Keep split and merge histories instead of assuming one-to-one relationships.
 TECHNOLOGY & DESIGN
MANUFACTURING / CAPABILITY
A data foundation for investigating quality variation: align quantities, process conditions and inspection results before designing the dashboard.
Explore the delivery scope ↓Conceptual data-to-operation flow, adapted to the agreed project scope.
Daily reports, lot inspections and second-level sensor logs have different grains. Joining them directly can multiply rows and distort defect rates or downtime. Define the mapping from work order to finished lot first.
THE SHORT ANSWER
A data foundation for investigating quality variation: align quantities, process conditions and inspection results before designing the dashboard.
DESIGN & DELIVERY
Map product, work order, process and lot. Keep split and merge histories instead of assuming one-to-one relationships.
Separate preliminary and finalized totals, and define the treatment of rework, retests and scrap. Preserve explanations for differences from daily reports.
Navigate from defect category to lot, conditions and original records. Treat correlation as a lead for investigation, not proof of causation.
DATA READINESS
A consistent format does not ensure operational usefulness. Confirm meaning, refresh and exceptions with owners, and keep missing information explicit.
| Data | Required fields | Checks |
|---|---|---|
| Production | Order, product, quantity and process time | Rework duplicates and lot splits |
| Inspection | Result, defect type and inspected quantity | Different denominators for sampling and full inspection |
| Equipment | Asset ID, state and timestamp | Clock drift, missing values and units |
EVALUATION
These are candidate evaluation measures. Establish a baseline and agree on data, period, targets and exclusions before work starts. They are not claimed performance results.
| Measure | Evaluation method |
|---|---|
| Traceability | Traceable lots divided by in-scope lots |
| Reporting effort | Active time from source collection to reconciled report |
| Defect rate | Agreed defect count divided by inspected quantity, with a fixed retest rule |
Replacing MES or control equipment is not a prerequisite. Start with available exports and expand integrations after confirming access conditions.
Review data mappings, workflow, prototype and evaluation evidence before choosing production scope. Estimates distinguish assumptions because permissions and interface terms affect implementation.
Select one line or asset group and one goal: quality investigation or anomaly notification.
QUESTIONS BEFORE YOU START
Yes. Start with production and inspection reconciliation. Predictive maintenance needs a separate assessment of sampling and event history.
No fixed reduction is promised. First validate traceability and investigation effort, then evaluate quality interventions through plant trials.
RELATED FIELD GUIDE
MANUFACTURING / GUIDE
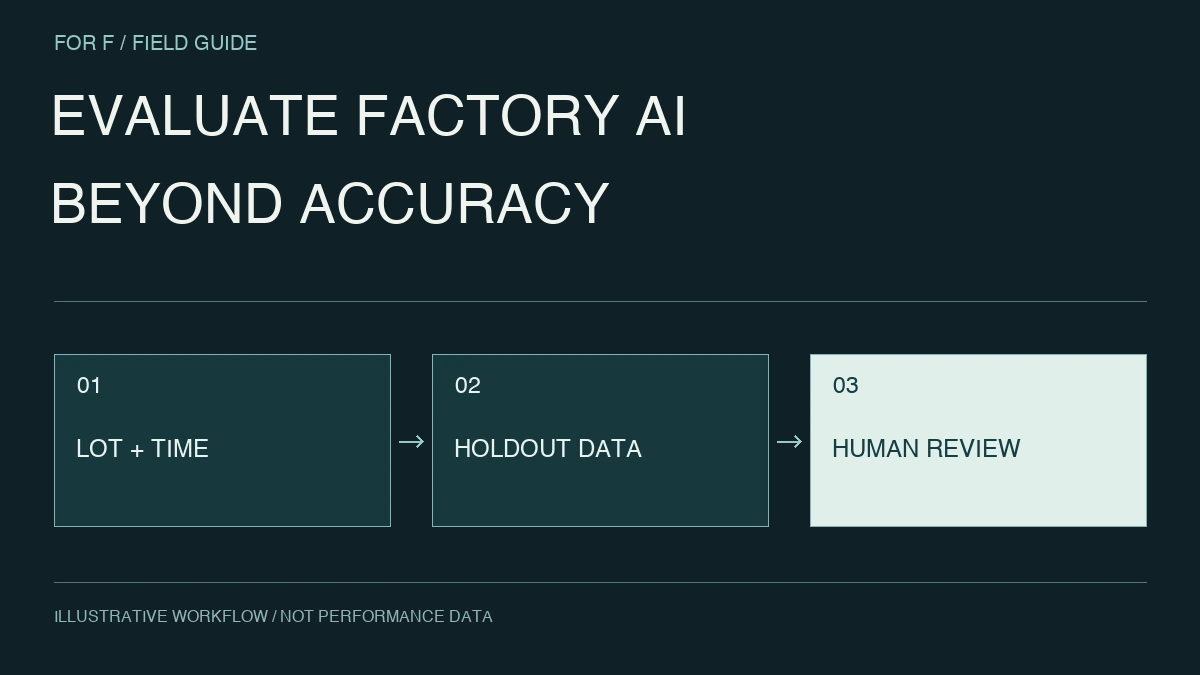
Before commissioning factory AI, define how evaluation data is separated and how operators will review results. This guide explains common pitfalls and a practical evaluation brief.
Read the guide ↗YOUR OPERATION / OUR STARTING POINT
Tell us about the workflow, systems and reporting or documents that need attention. We will define a suitable phase, deliverables and assumptions.
Manufacturing — discuss your project How scope and estimates work ↗