
KEY TAKEAWAY
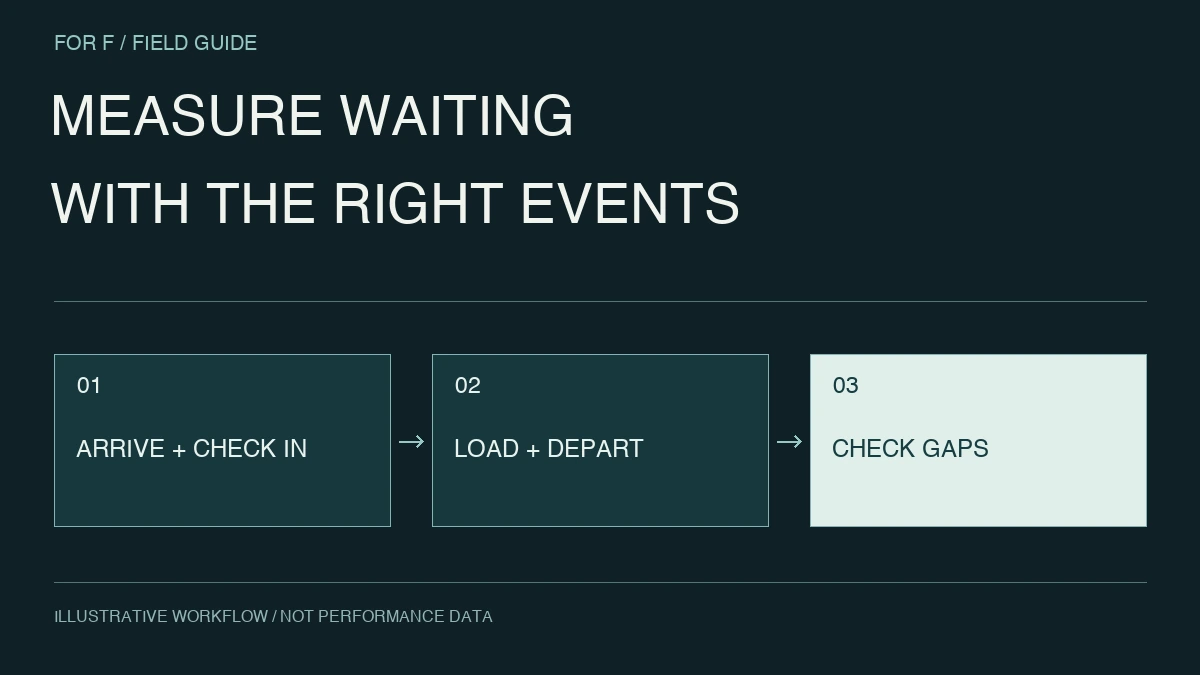
Trace complete visits at one site and confirm what each event actually means. Keep unknown intervals explicit and report event completeness alongside durations.
1. Separate dwell from waiting
Dwell time includes reception, waiting, handling, inspection and paperwork. Separate these intervals and agree on the treatment of arrivals before booked slots.
This is an operational measurement design. Regulatory reporting needs a separate check against current official applicability and calculation guidance.
2. A vehicle number is not a visit
The same vehicle may visit several times or leave and return. Use a visit identifier built from trip, booking, date and site, with an explicit re-entry rule.
Map different reception and WMS identifiers. Do not silently drop unmatched visits; show their count and reason.
3. Missing is not zero minutes
Without a handling-start event, waiting cannot be calculated. Converting it to zero can make poorly recorded sites appear efficient. Show metrics for complete visits beside the completeness rate for all visits.
Distinguish forgotten entry, unavailable devices and events that do not exist in a site’s workflow; each requires a different intervention.
4. Move from averages to actionable groups
Company averages can improve while specific time windows remain congested. Group by site, customer, load type, weekday and window, showing sample counts.
Reconstructing one long visit with the operating team often produces a more concrete discussion than a chart alone.
5. What the dashboard brief should include
Include event definitions, visit mappings, missing-data and correction rules, and links to original records. The team should know which visit and owner to inspect when totals differ.
Before-and-after periods should account for volume and operating days. One day after deployment is not evidence of sustained improvement.
6. Establish the model at one site
At one site, investigate differences between measured data and operational understanding. Assess manual capture against its workload before expanding to different reception processes.
For f can scope read-only analysis across TMS, WMS and dispatch sheets. Existing reception records and examples of difficult time windows help define the first validation.
A concrete acceptance check
Check identical trips with gate staff and dispatch managers. Acceptance requires agreement on periods and event definitions; sites needing better recording can be separated from implementation scope.
Before commissioning
- Share event definitions.
- Define re-entry and multiple-trip identifiers.
- Show missing-data rates and sample counts.
- Keep source records accessible in improvement reviews.
Explore support for this industry
Logistics and transport — data and AI overview ↗